Projects are complicated things. And it always seems like there's so much to do, yet so little time to do it in. Project managers need ways to visualise the project plan, so that it makes sense to them and to any other stakeholders that the information may be shared with.
There are many ways of doing this. We could use a Network diagram or PERT chart, for example.
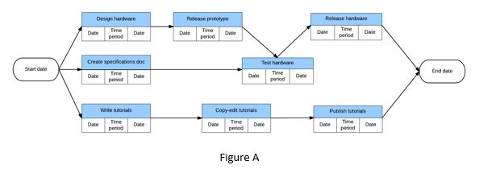
PERT charts are generally used during the planning phase of a project and allow the project manager to visualise the relationships between the tasks and perform a Critical Path analysis.
Gantt charts, on the other hand, are usually used during the execution phase of a project, and show us when the tasks are happening, and allow the project manager to track the progress of the project.
This is usually done by listing the various activities within the project down the left, and tracked against time, which runs left to right across the page or board, whatever medium is being used.
The History of Gantt Charts
Charts similar to Gantt charts have been around for quite a long time. The first known example was created in 1896 by Karol Adamiecki and was called a Harmonogram. The Harmonogram wasn't widely used, which allowed Henry Gantt to lend his name to his own design in around 1910.
This was well before the advent of computerised project management software packages, so early Gantt charts had to be redrawn constantly, whenever the project changed. To get around this, project managers would cut out paper strips to represent tasks and slide them along wall mounted charts.
When personal computers arrived in the 1980s, the representation of projects as Gantt charts started to take off, computers made it far easier to lay out the initial plan, and then automatically redraw it when things changed.
Using Gantt Charts in the Real World
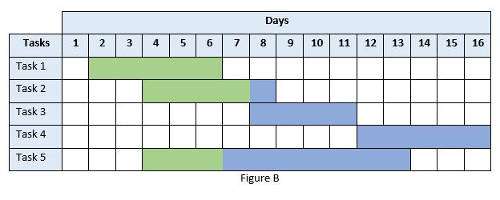
A simple Gantt chart can be created in a Microsoft Word table. In the table below, we have a list of tasks and a series of coloured bars to show when they are happening against a timescale along the top. Unfortunately, doing it in Word means that of changes occurred to your project, you would need to go to these diagrams and alter them manually.
Excel would probably do a better job than this. By adding some formulas and a bit of conditional formatting, we could create a simple Gantt chart that was easily updatable.
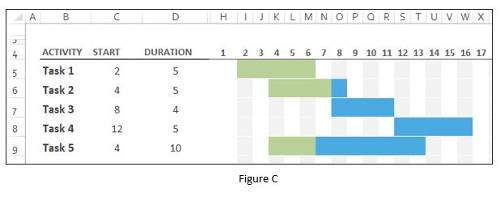
Excel Gantt charts are only suitable for small scale projects though. As the number of tasks increases, and the timescale is longer, we need to start looking at dedicated project management software such as Microsoft Project or Primavera.
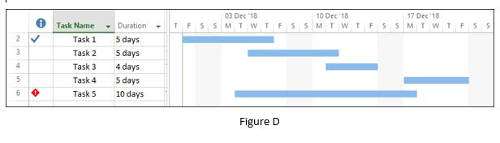
Microsoft Project creates the Gantt chart for us, based on the information we supply.
What is a Gantt Chart for?
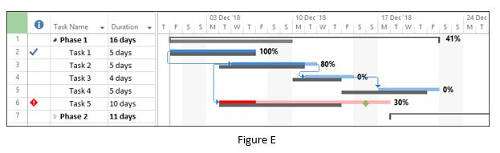
Using a package like Microsoft Project, the Gantt chart can be customised to quickly show the information we are interested in. In this screenshot, the Gantt chart has been set up to contrast the planned task start and finish against the actual start and finish dates, as well as information about how much of the task has been completed and deadlines set for the remaining tasks.
So, a Gantt chart is a tool that allows the Project Manager to visualise what is happening in their project, and in the hands of an experienced project manager and using the right software, can display a lot of information.
But what specifically is it helping us to visualise? There are five main things.
- The various activities to be completed during the course of the project. In any of the figures here, they are listed as Task 1, Task 2 etc.
- When each activity is scheduled to start and to finish.
- How long each activity is meant to take in order for it to be completed. Using the correct software, this is now calculated automatically for you, and can figure in whether weekends are to be included or not, in terms of actual work days. You can then also compare actual time taken compared with planned time taken, and make an adjustment of necessary.
- On what occasions the various activities overlap one another, and by how much. For example, in Figures B and C, you can see that task 2 overlaps task 1 on days 4-6. So although they each take five days to complete, because of the three day overlap, the two tasks together can be done in seven days.
- The start and finish dates of the entire project. You can create a critical path that highlights the shortest time period in which to complete all the required tasks, taking into account which tasks overlap, and which ones are dependent on another having been completed first. Based on point 3 above, should the actual times taken be different to planned times, adding this data will then see an adjustment in both the time taken, the critical path and the finished date.
How useful a particular Gantt chart proves to be is dependent on the data that's entered into it, of course. It requires a competent project manager that will continually update and tweak the data as the project goes on. If not, it will only ever show the initial plans laid out, and fail to allow for any deviations that occurred along the way. So
knowing how to use software like MS Project is essential to the modern project manager.
But if this data is correctly and thoroughly entered, and updated as the project goes on, these five things prove invaluable to the project manager. In the blink of an eye, the manager is able to see what still has to be done, and how long it will take, and what the expected date of completion is.
They will both be in control, and appear to be thoroughly professional to any other stakeholders asking for updates as the project goes along.