OK, let's get the boring bit out of the way first. A Pivot Table is a statistical tool to extract and summarise data from large data sets.
Or, as
Microsoft say in their own words: "A PivotTable is a powerful tool to calculate, summarize, and analyze data that lets you see comparisons, patterns, and trends in your data."
Now, that's a pretty dry piece of text. I prefer to think of a Pivot Table as: A really cool way to get to the stuff that's actually important to you.
A History of Pivot Tables
A bit of History. Pivot Tables have been around for a long time (well in Personal Computer years anyway).
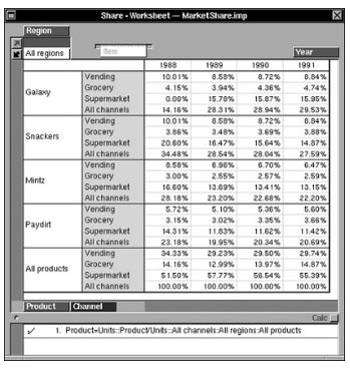
Lotus was first to the market with a Pivot Table enabled spreadsheet, Improv, in 1991. Microsoft joined the party in 1994, when Excel 5 included Pivot Table functionality for the first time. Since then, most of the other contenders have fallen by the wayside and although LibreOffice and Google Sheets support Pivot Tables, the undisputed King of Pivot Tables is Excel.
So, why would you want to use one?
If you'd like to learn more about Microsoft Excel, why not take a look at how we can help?
We have a whole range of online courses for all skill levels.
RRP from $39 – limited time offer just $8.99
Why to Use Pivot Tables?
Well let's imagine that you have a large set of data. This could be last month's sales data from your on-line shop, Medical procedures carried out in a particular NHS Trust area, or raw meteorological data recording temperature and sea level readings.
These are all very useful sets of data, but the real value, the interesting stuff, is buried deep inside the data. What was the bestselling product (or the fifth)? Which operating theatre had the highest failure rate? What was the average air temperature month by month in a specific location?
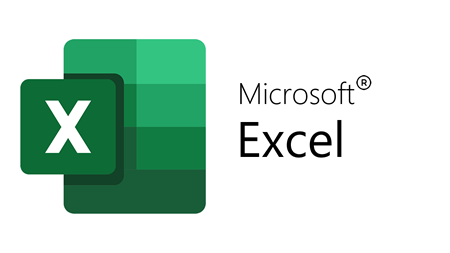
Now, in most cases we can use other tools; filters, subtotals, formulas, conditional formatting to get at this data. Here is a table (not a Pivot Table) showing sales data broken down by Sales Person and Category.
And here is the formula I used to get a single value:
=SUMIFS(salesdata[Total],salesdata[SalesPerson],$C7,salesdata[Category],D$6)
This took me around 5 minutes to produce, not bad from over 30,000 rows of data.
Of course, I had to extract a unique list of sales people and categories first, and I used Table formulas to make my life a bit easier.
The real problem here is first understanding how you will solve the problem, then of course, you must implement it. My 5 minutes were spent implementing, I already knew how I was going to do it. (If you don't know how to do that, it's going to take waaaaay longer.)
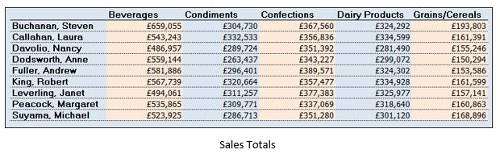
The next Screen shot shows the same data produced by a Pivot Table.
The big difference? This took me 15 seconds and I didn't have to write a single formula. OK, admittedly I'm pretty good at producing Pivot Tables, but with a little training, even a novice Excel user could produce this in less than a minute
Not convinced? Producing the basic Pivot Table was just the start. What if we change our minds?
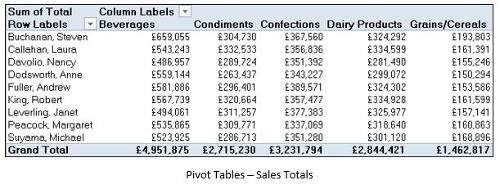
This time Management have asked us to show all sales performed year on year to make it easier to see increases and/or decreases. (See, looking for a pattern.)
Whilst the management team are happy with this, they need to able to quickly drill down and see the figures for a category of product.
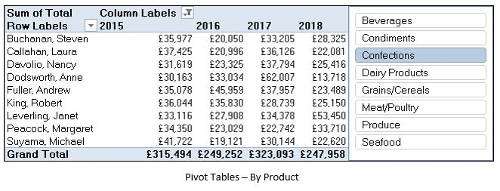
Here, we have added a Slicer to the Pivot Table, so we can quickly filter the Pivot Table to show a sub-set of the data.
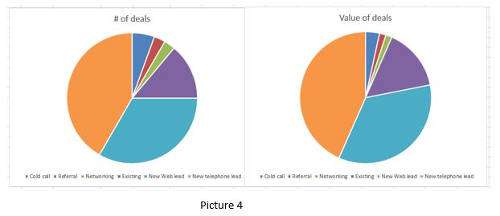
Seeing how useful this data from Pivot Tables is turning out to be, the Marketing Department decides to get in on the act. They need to see the sales data broken down by country, year on year. But they really need to see the % difference in the years so they can focus the marketing budget where it needs to go.
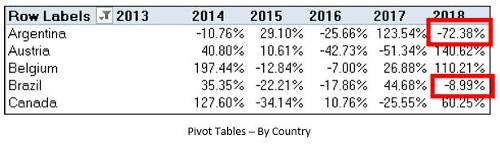
Now the Pivot table has been arranged to show the % difference year on year for each country and we can see that our 2018 sales in Argentina are 72% down on the 2017 total.
Our final request was from the Sales department again. It's bonus time and they want to know how each sales person did and how they ranked overall in 2018.
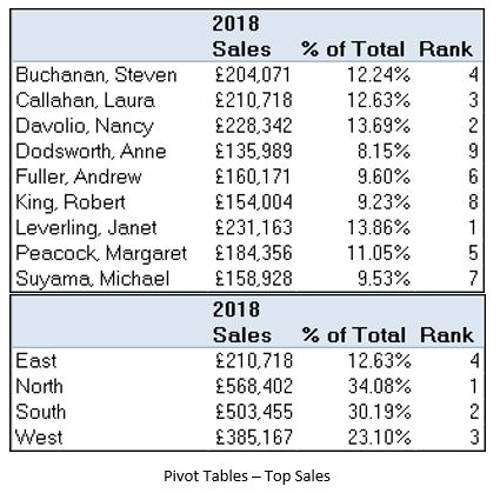
Now we can easily see that Janet Levering with 13.86% of sales wins. And just for good measure we threw in the same breakdown, but for sales regions. That's the thing with Pivot Tables, once you start, you want to know more.
Now, I've used sales and marketing examples here, but is that where the use of Pivot Tables is most useful?
Absolutely not. Anybody that wants to analyse their data and look for patterns and trends can use them. For example, a colleague of mine was completing his dissertation a few years ago. He had compiled a unique research project into whether having children meant that people were happier or not. His questionnaire had 15 questions, and he loaded all the results into Excel.
When it came time to analyse that data, nothing was more useful than Pivot Tables. For example, he may have decided to look at how many women in the 21-30 age group, with no children, gave a particular happiness score out of 6.
His interrogation of the data was excellent, and he obtained a first class pass. He admits that he owes most of that to Pivot Tables.
If you'd like to learn more about Microsoft Excel, why not take a look at how we can help?
We have a whole range of online courses for all skill levels.
RRP from $39 – limited time offer just $8.99
I could go on, but the thing is, sometimes we don't know what we want until we see it. You could easily waste an hour or two trying different combinations of data and getting a headache thinking of the complex formulas to generate the results. A Pivot Table can give you the results in seconds.
These days, everyone is talking about their ‘journey', and whilst life's journey can teach us many things, in business, it's the results that count. And the quicker we can get to those results the better.
This is what Pivot Tables are used for.
Now, while the Microsoft applications all have some features that are fairly easy to use, even intuitive, Pivot Tables is not one of them. They are an Advanced feature, and while incredibly useful, it's really difficult to teach yourself, so it's good to get some
training if you plan to use them.
For most training companies, Pivot Tables occurs in the
Advanced level. At ZandaX, that's the case as well, with some further advanced uses of Pivot Tables also being covered in the
Professional course.
So that's what Pivot Tables are for, and where to find out how to use them.
I hope that you do take the time to learn how to use them, as they can radically impact your abilities, and enhance your career.